像比特币、以太坊这样的区块链中包含了大量的数据,可以帮助 我们洞察区块链生态系统中用户、企业和矿工的行为模式等重要信息。 BlockSci是一个C++开发的高性能的区块链数据分析框架,可以帮助 我们快速进行对比特币等区块链的数据分析工作。本教程将介绍 BlockSci区块链数据分析框架的安装方法,并讲解如何利用BlockSci 框架进行区块链数据分析。
1、安装BlockSci框架
BlockSci的主要开发语言是C++,本地编译需要GCC 7.2+和CLang 5+。 官方文档仅提供了Ubuntu 16.04和Mac OS10.13下的本地安装方法, 其他系统可以尝试本地安装或使用官方提供的AWS EC2镜像。
2、BlockSci框架概述
BlockSci包含两个主要的组件:解析器和分析库。解析器用来解析 区块链数据并转换为便于执行分析任务的BlockSci数据格式。分析库 则用来编写数据分析任务。

BlockSci的运行需要大量内存,推荐使用64GB内存,32GB虽然也可以用 但性能下降非常明显。
3、BlockSci解析器 / Parser
BlockSci的解析器支持两种处理原始区块链数据的机制:磁盘模式和RPC模式。
磁盘模式是处理比特币 区块数据的推荐模式,它可以直接读取并解析磁盘上的 比特币区块数据文件,因此速度要快得多。但是这也意味着磁盘模式不能 支持更多的区块链,因为不同的区块链的磁盘数据文件格式不同。
使用以下命令以磁盘模式解析比特币区块数据:
1 | blocksci_parser --output-directory bitcoin-data update disk --coin-directory .bitcoin |
参数说明:
- –output-directory:解析结果输出目录
- –coin-directory:bitcoin core数据目录
RPC模式使用数据加密货币区块链节点的RPC接口来提取数据,而RPC接口是 大多数(山寨币)区块链都支持的与比特币类似的二次开发接口(虽然优势也有一些差异), 因此在比特币之外的区块链数据解析,BlockSci通常采用RPC模式, 例如对于Zcash和Namecoin。
要使用RPC模式的BlockSci解析器,需要一个区块链全节点并且启用txindex选项。 命令格式如下:
1 | blocksci_parser --output-directory bitcoin-data update rpc --username [user] --password [pass] --address [ip] --port [port] |
参数说明:
- –output-directory:解析结果输出目录
- –username:RPC API用户名
- –password:RPC API用户密码
- –address:RPC API监听地址
- –port:RPC API监听端口
4、BlockSci分析库 / Analysis Library
一旦利用解析器提取了区块链数据,就可以利用BlockSci的分析库来执行数据分析 任务了。BlockSci目前支持两种语言来开发区块链数据分析应用:C++和Python。
要使用C++版本的BlockSci分析库,需要添加必要的BlockSci头文件并链接BlockSci 动态库。然后就可以利用解析器输出目录里的数据进行分析了,例如下面的代码:
1 | #include <blocksci/blocksci.hpp> |
BlockSci目前仅支持Python 3,使用方法很简单:导入BlockSci库,然后利用 解析器输出目录的数据构建Blockchain对象:
1 | import blocksci |
5、BlockSci区块链数据分析示例
这一部分我们使用Python版本的BlockSci来介绍如何进行比特币区块链的数据 分析。
首先导入必要的库并利用解析器输出数据构建BlockSci的Blockchain对象:
1 | import blocksci |
5.1 比特币地址类型使用情况分类统计
使用BlockSci的区块链对象的map_blocks()方法统计不同类型的地址
在每年的使用量:
1 | net_coins_per_block = chain.map_blocks(lambda block: block.net_address_type_value()) |
显示结果如下:
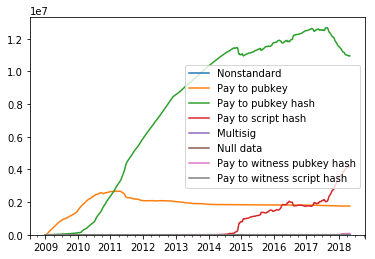
可以看到P2PKH地址的使用从2017年中开始减少,而P2SH地址的 使用同期则开始增加 —— 这应该对应着各种钱包对隔离见证地址支持 的增加。
5.2 比特币单区块交易手续费率可视化分析
下面的代码使用BlockSci的区块链对象的[]操作符提取
比特币465100#区块内各交易的手续费率并进行可视化分析:
1 | example_block_height = 465100 |
显示结果如下:
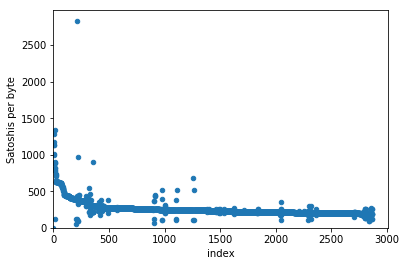
可以看到该区块内绝大多数交易的手续费率设置在500SAT/BYTE以内。
5.3 比特币二层协议使用情况可视化分析
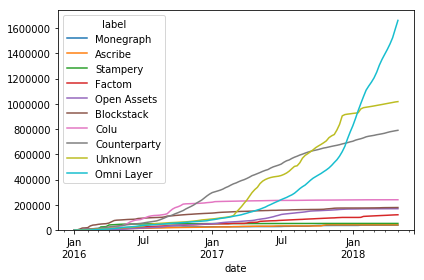
在比特币交易内可以嵌入二层协议以实现对其他应用的支持,例如omni layer
的usdt代币就是最常见的一种比特币二层协议应用。下面的代码
使用BlockSci的区块链对象的blocks.txes属性提取在交易输出中
包含OP_RETURN脚本的交易,并显示二层协议的使用情况,可以非常清楚的看到,
Omni layer到目前已经是二层协议的最大用户:
1 | txes = chain.blocks.txes.including_output_of_type(blocksci.address_type.nulldata).all |
显示结果如下:
5.4 比特币2017年各月平均交易手续费可视化分析
下面的代码统计年度平均手续费并将手续费换算为美元,注意
其中利用了BlockSci分析库中的CurrencyConverter进行汇率换算:
1 | converter = blocksci.CurrencyConverter() |
显示结果如下:
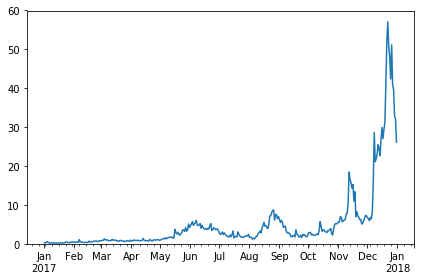
可以看到在2017年底比特币手续费激增。
5.5 比特币大额手续费交易可视化分析
下面的代码分析并可视化历年来手续费超过1000美元的比特币交易:
1 | high_fee_txes = chain.cpp.filter_tx("fee(tx) > 10000000", 0, len(chain)) |
显示结果如下:

2017年超过1000美元手续费的交易激增,从一个侧面说明了这一年 涌入了大量数字加密货币的新手。
汇智网原创,转载请标明出处